GMT Part 2: A topographical map of South-Africa
I hope this does not come across as a tutorial of some sort, I am mostly writing things down for myself. But I know someone might one day copy and paste this as I’ve done numerous times, but this mostly for me to master GMT. In the previous GMT related post I created this basic map of South-Africa. The map does not however have any cities, provincial boundaries or topography.
A basic map of South-Africa created with GMT:
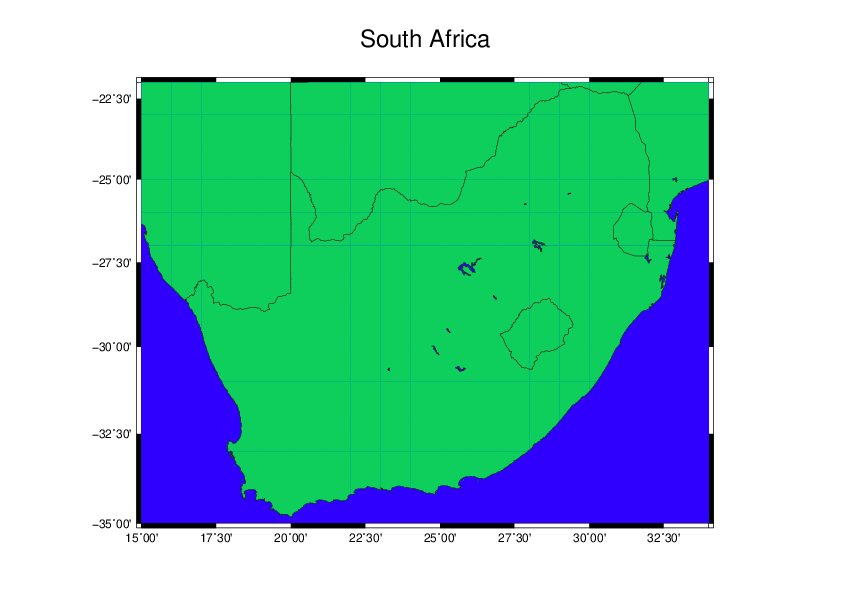
Note that I converted is from postscript format to reduce size.
So first we need to get some external topographic and administrative data for South-Africa. In this case I’ll use ETOPO data from the National Center for Environmental Informatics. The cool thing about the Etopo data is that it is already availible in the GMT readable grd format.
wget https://www.ngdc.noaa.gov/mgg/global/relief/ETOPO1/data/bedrock/grid_registered/netcdf/ETOPO1_Bed_g_gmt4.grd.gz
gunzip ETOPO1_Bed_g_gmt4.grd.gz
The data can be inspected with ncdump or another GMT tool, grdinfo,
ncdump -h ETOPO1_Bed_g_gmt4.grd
gmt grdinfo ETOPO1_Bed_g_gmt4.grd
Next we need the administrative data for South-Africa. GMT only has the national boundaries for world countries and then also the data for US states. The admin data can be freely obtained from the GADM Database. We need to get the shapefiles for SA in this case.
wget http://biogeo.ucdavis.edu/data/gadm2.8/shp/ZAF_adm_shp.zip
unzip ZAF_adm_shp.zip
The shapefile data needs to be converted for use in GMT. This is done with a GDAL tool, ogr2ogr. GDAL is a amazing resource and in my mind the most powerful Geospatial tool out there. If you already have GDAL installed correctly, we can prepare the admin data. I only wanted the SA provinces so we do,
ogr2ogr -F GMT ZAF_adm.gmt ZAF_adm1.shpWhich converts the shapefile into a GMT readable format. So now we have topography data and provincial data to create a more detailed map. I have removed the colors specified by the -R and -S switch for the basic. The topography color table will create colors for the map. Lets create a bash script to plot the map.
#!/bin/bash

# MAKE A MAP!
# Define the names of the input and output files
out=southafrica_topo.ps                           # This will be the name of
topo=./ETOPO1_Bed_g_gmt4.grd                   # ETOPO1 topography grid
admin=ZAF_adm1.gmt			       # Provincial boundaries

# Define map characteristics
# Define your area 15/33.5/-35/-22
north=-22
south=-35
east=34
west=15

# Define tick intervals and projection
tick='-B2.5/2.5WSen'
proj='-JM20'

# Call GMT, define basemap coordinates, make a color table and plot
gmt psbasemap -R$west/$east/$south/$north $proj $tick -X6 -K > $out
gmt makecpt -Crelief -T-7500/7500/200 -Z > topo.cpt
gmt grdimage $topo -R -J -O -K -Ctopo.cpt >> $out
gmt pscoast -R -J -O -K -W0.25 -Df -B+t"South Africa" -Na0.05 -I1/0.25p,skyblue3 -I2/0.25p,skyblue3 >> $out
gmt psxy $admin -R -J -K -O -W0.05 -V >> $out
open $out
This is the map we should get,
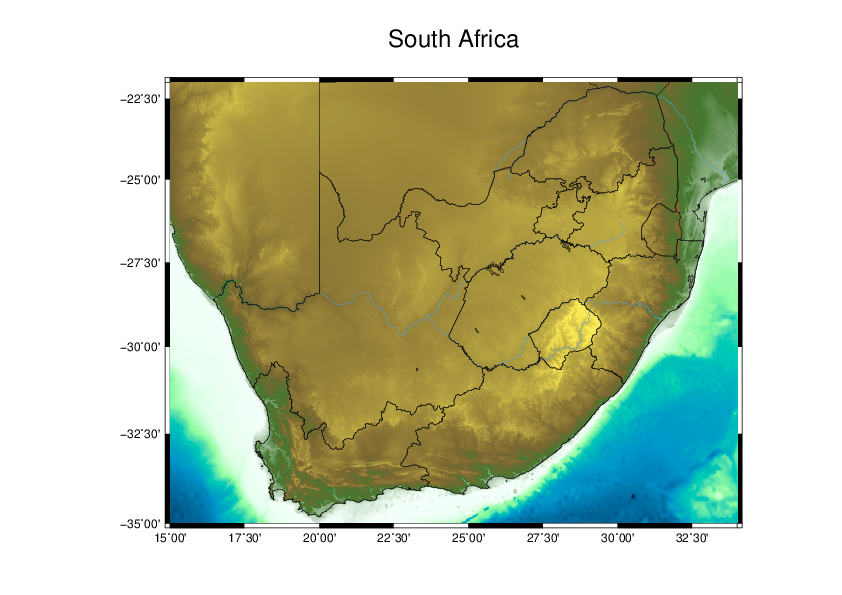
Play around with the -T- option to get the desired colors. This map looks a little cooler then the first basic map, however, there is no names of cities or anything, lets change that. So in GMT you need a list with the latitude and longitude of cities to plot in the map, something like this:
28.05   -26.21  14 0 1 LM Johannesburg
28.23   -25.71  14 0 1 LM Pretoria
29.45   -23.89  14 0 1 LM Polokwane
26.15   -29.08  14 0 1 LM Bloemfontein
18.42   -33.92  14 0 1 LM Cape Town
31.02   -29.85  14 0 1 LM Durban
25.52   -33.71  14 0 1 LM Port Elizabeth
22.45   -33.99  14 0 1 LM George
17.89   -29.17  14 0 1 LM Springbok
25.64   -25.85  14 0 1 LM Mahikeng
30.97   -25.48  14 0 1 LM Nelspruit
22.58   -32.35  14 0 1 LM Beauford-Wes
The first and second column tells us the lat/lon of the city we want on the map while the other columns is related to text size, marker and of course the name of the city. In GMT we’re calling the psxy function to plot the points. Now all that’s required is to call the psxy and pstext to plot the location and names of the cities respectively.
#!/bin/bash
# MAKE A MAP!
# Define the names of the input and output files
out=southafrica_topo.ps # This will be the name of
topo=./ETOPO1_Bed_g_gmt4.grd # ETOPO1 topography grid
admin=./ZAF_adm1.gmt # Provincial boundaries
cities=./towns.dat # Towns to plot on map
# Define map characteristics
# Define your area 15/33.5/-35/-22
north=-22
south=-35
east=34
west=15
# Define tick intervals and projection
tick='-B2.5/2.5WSen'
proj='-JM20'
# Call GMT, define basemap coordinates, make a color table and plot
gmt psbasemap -R$west/$east/$south/$north $proj $tick -X6 -K > $out
gmt makecpt -Crelief -T-7500/7500/200 -Z > topo.cpt
gmt grdimage $topo -R -J -O -K -Ctopo.cpt >> $out
gmt pscoast -R -J -O -K -W0.25 -Df -B+t"South Africa" -Na0.05 -I1/0.25p,skyblue3 -I2/0.25p,skyblue3 >> $out
gmt psxy $cities -R -J -K -O -W1 -St0.25 -G255/0/0 -V >> $out
gmt psxy $admin -R -J -K -O -W0.05 -V >> $out
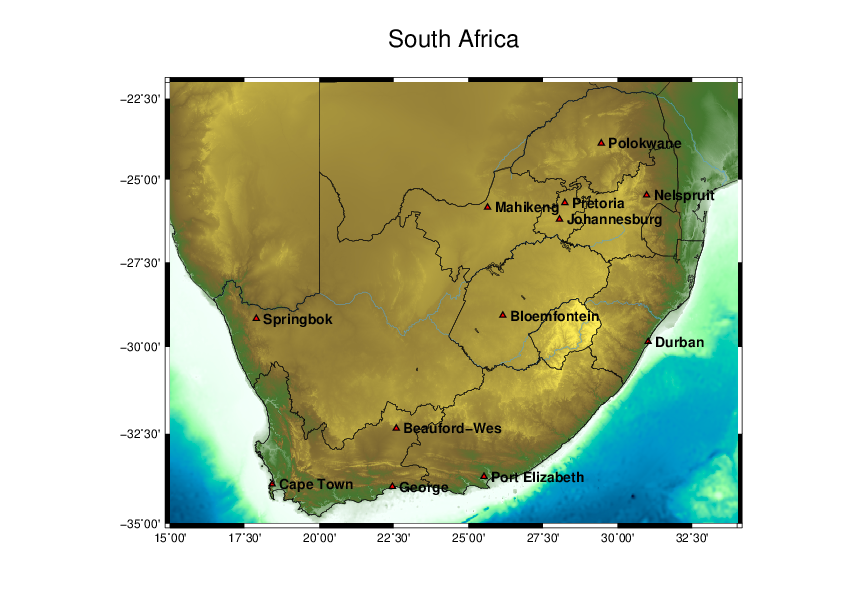
gmt pstext $cities -R -J -X0.25 -O -K >> $out
open $outAnd tada, a map with some cities in South-Africa