Making an interactive radar map with GDAL
This post builds on the previous post. As you’ve seen the image from Titan is a static map of the radar coverage. To improve the map we wanted something interactive where you can zoom and all that fancy stuff. I made a map with my favorite tool, yes you guessed right, GMT, however it was still a static map so no luck there. Next I explored some online options, the easiest was Mapbox. However, it was not that easy. I actually have to lay out the whole Radar -> Webserver process to underline how not so easy it is to get workable data, and by workable data I mean netCDF files and if you think netCDF is an easy file format to work with, think again.
Without going into to detail about the radar itself, the process of getting the current static image is something like this:
Magnetron Generates Pulse -> Radar Echos -> Receiver Converts -> Titan Processes -> P2P 1 -> P2P 2 -> P2P 3 -> Local Server -> Webserver -> Lekwena Website
Not a lot of room for error you see (I’m kidding, there’s a lot of room for errors and we experience them all).
The data is also not netCDF, it’s MDV data. What’s MDV data, well I don’t know but that’s what Titan gives us. Lucky for me there’s a Mdv2netcdf script in the software so it’s possible to transform the data to something I can work with.
Back to mapbox, after doing the whole Mdv2netcdf I hoped I could natively import the netcdf file without hassle. Apparently not, the fix was relatively easy. Mapbox takes GEOtiff files and I remembered using gdal_translate for something in the past and after a very quick Google I did:
gdal_translate radarin.nc radarout.tifand this gave me a very gray image
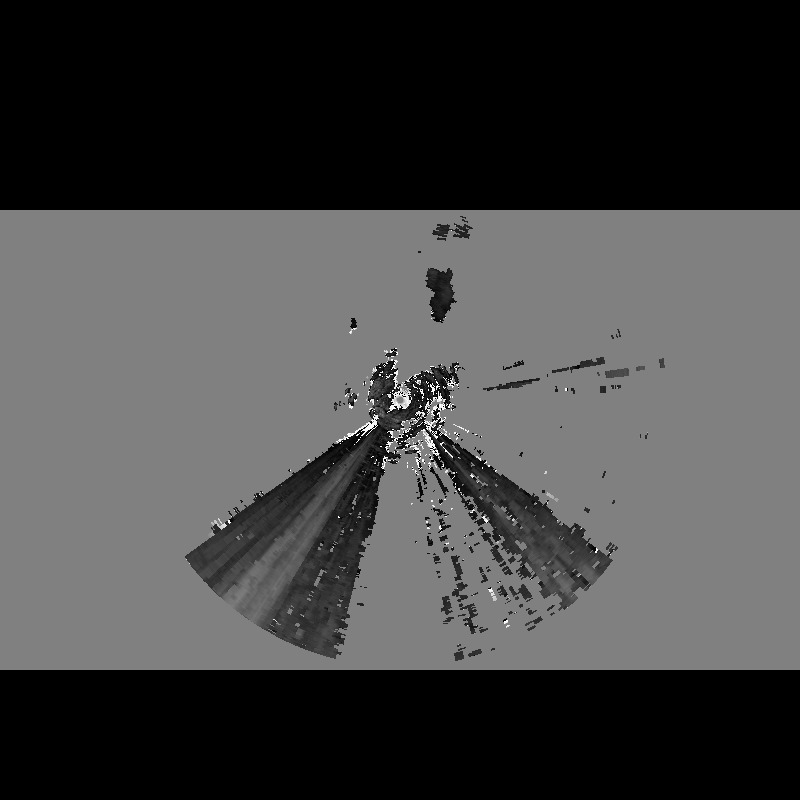
Although not ideal, the tif image can be imported into Mapbox and it works, but a gray radar image makes no sense and it’s hard to distinguish dBz. Using gdalinfo you can inspect the tif or original netcdf file and you’ll see it only has one band representing dBz. To actually make a color map of dBz I figured out you have to use gdaldem. First you have to make a color palette and according to gdal’s website “Since GDAL 1.8.0, GMT .cpt palette files are also supported (COLOR_MODEL = RGB only).”. Anyway I didn’t use a cpt but it’s nice to know.
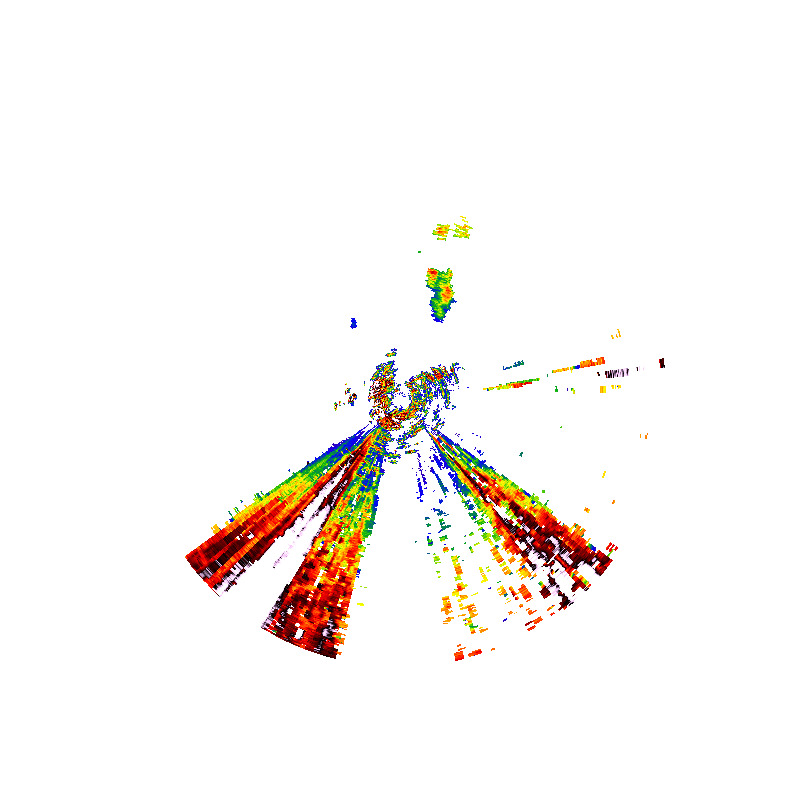
So after creating your palette, run gdaldem:
gdaldem color-relief nc20171230_000123.nc -alpha radar_pal.txt -of GTiff outfile.tiffand look what a nice image we have, all colorful and everything. However it is still static
With this overflow of gdal knowledge in me I discovered gdal2tiles. Possibly the best discovery yet. Now I did not need Mapbox anymore, I figured I can create my own interactive map without the need to register some place.
Using gdal2tiles is as easy as
gdal2tiles.py -z 5-10 outfile.tiffand now we have a really cool map (click on the layer tab in the map), which we are currently experimenting with before we put it on the lekwenaradar website hosted on github. Best of all it seems to work :)
Now our chain gets a bit more links which means more places for possible failure, but we have a way cooler map. To revisit the process:
Magnetron Generates Pulse -> Radar Echos -> Receiver Converts -> Titan Processes -> P2P 1 -> P2P 2 -> P2P 3 -> Local Server -> Mdv2netcdf -> gdal_translate -> gdaldem -> gdal2tiles -> Webserver -> Lekwena Website
All in a day’s work