Launching the NWU-Lekwena radar
The North West University Potchefstroom has a pretty cool C-band radar currently under development. The radar, a WSR74-C radar, was previously located in Texas and after three decades it was redeployed to South-Africa for research purposes. The project was initiated before I started my graduate studies, but since 2016 we have slowly worked to get the radar operational. The site location and deployment of the radar was already completed in 2015 and since then most problems have been related to data transfer from the radar site to the university 30km away, we continue to have some troubles with interference on the radar frequency and unreliable power. Considering all this we managed to get the radar operational and running on a more permanent bases. We also designed a simple website using Jekyll which you can view on www.lekwenaradar.co.za.
It is worth noting that the software used for signal processing is RDAS while the Thunderstorm Identification, Tracking, Analysis and Nowcasting (TITAN) contains algorithms to track and analyse storm intensities and paths. The history of Titan and RDAS starts in South-Africa (can I say proudly South-African?) and is quite interesting.
The Website
The development of www.lekwenaradar.co.za happened pretty rapidly. Having some experience with Jekyll I advocated for deploying a static site and the convince of using GitHub to host it as two major advantages and it worked. Due to the rush to get something online I worked off a custom Cayman theme. This allowed for hamburger menu on a mobile phone. We also added some other sites to make a more interactive weather website. This was mostly from the European Organisation for the Exploitation of Meteorological Satellites (EUMETSAT). To add my own synoptic maps I set up a crontab that goes through all the downloading processes and then it pushes it automatically to the radar site every morning.
How to interpret the radar image
Because we give a very raw product and also the fact that the radar is not meant used as a severe weather alert system I wrote a short description of how users should view the image above. I wrote this for the website and I’ll copy it here. Below is a real-time image of the radar if it’s running smoothly.
How to interpret the radar image
Time
The radar is set to Coordinated Universal Time (UTC) and not South African Standard Time (SAST). To correct for this you need to add two hours to the time as indicated below, for example 12:04 UTC + 2 Hours = 14:04 SAST. To check if the radar is currently running the time should match within +-10 minutes of the actual time, if it doesn’t it’s safe to assume the radar or webserver is down.

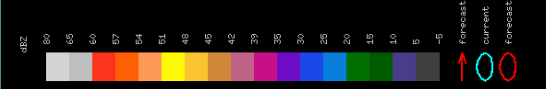
Reflectivity (dBZ)
In the most basic terms a radar’s operation consists of a high frequency signal pulse that’s generated from the site, this signal echo’s when it interacts with large particles such as hail or raindrops and a receiver converts the echo into something human interpretable. This echo is represented as decibel relative to Z or dBZ. Strong dBZ means there are large particles producing a strong echo, this would be large rain, hail or ice particles in clouds.
Interference
The NWU Lekwena Radar has an license to operate on the 5.62 gHz bandwidth and any WiFi or communication network between 5.55 to 5.67 gHz causes problems and hampers data quality. The public is encouraged not to use these bandwidths in the Potchefstroom area and the NWU-CRG is willing to help users mitigate interference by advising on the installation of Dynamic Frequency Selection (DFS) devices. Users can also contact their service providers to learn more about the frequency of their devices and how to avoid interference with the Radar.
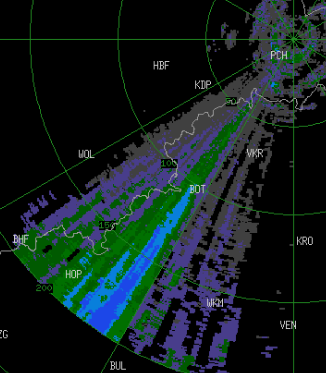
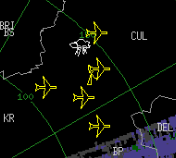
Places Indicators
The radar indicates towns with abbreviations and also some regional airports in the Gauteng Area with the Airplane sign. The little cloud sign indicates the location of the SAWS Irene Weather station. The circular lines indicate the distance of from the radar site, which is a maximum of 200km due to various factors such as the curvature of the earth