Retriving point values from GFS data
I guess I can safely say most of time is dedicated to making our radar website cooler. I’m pretty lucky. So we currently have three things on the website, the radar (obviously), and then two GFS visualizations. The first is a synoptic scale map of the circulation around South-Africa, mainly mimicking the South-African Weather Service (SAWS) Synoptic Map, but the SAWS is not as lazy as me so my maps are drawn by a computer and not by hand. The second product, and I’m fond of this, is the general circulation of the Southern-Hemisphere. These maps were inspired by the work of Harry von Loon and JJ Taljaard.
Now, here comes the actual reason I’m writing this. The third map that’s currently in experimental phase is a provincial scale map. I wanted to achieve two things; (1) allow people to more clearly what’s happing in their little part of the word, this is not really clear on the synoptic map, and (2) give people values they can understand more accurately and not rely on interpreting a scale, by value I mean a number. The map themselves are made with the same script as the other maps, well more or less the same, and you can read on that here. This post details how to get a value of a Lat/Lon point from GFS data, and in this case minimum and maximum temperature.
First we need to grap the GFS data, this pretty simple with wget. I assumed two things here, rightly or wrongly so, (1) that 0600 gfs product will be an accurate reflection of the day’s minimum temperature and (2) that 1200 will be an accurate reflection of the day’s maximum temperature. My notes in the script should make it obvious what’s being done at each stage, but the most important is to convert the data to netcdf and then make the values human friendly (Kelvin -> Celsius). I use the Apparent Temperature at 1200 as the map background. We’re not trying to make an animation here instead just a one day static map that’s updated every morning.
#!/bin/bash
today=$(date +"%Y%m%d00")
gfs=http://www.ftp.ncep.noaa.gov/data/nccf/com/gfs/prod/gfs
forecast=(06 12)

# Loop through the specified forecast times wanted and grab GFS data
for i in "${forecast[@]}"
do
    wget $gfs.$today/gfs.t00z.pgrb2.0p25.f0$i
done

# For archive purposes we clip the data to South-Africa with cdo
# and convert GFS files to workable netcdf files
for i in "${forecast[@]}"
do
    cdo -sellonlatbox,-180,180,-95,0 gfs.t00z.pgrb2.0p25.f0$i gfs.$today.$i
    cdo -f nc copy gfs.$today.$i ncfile$i.nc
done

# To plot the files in GMT we need to get the variables from the newly
# created netcdf files by extracting only the variable we want.
for i in "${forecast[@]}"
do
    gmt grdconvert ncfile$i.nc\?aptmp -Gaptmp$i.nc
    gmt grdconvert ncfile$i.nc\?tmax  -Gtmax$i.nc
    gmt grdconvert ncfile$i.nc\?tmin  -Gtmin$i.nc
done

# Do some math
# We convert Kelvin to Celsius
for i in "${forecast[@]}"
do
    gmt grdmath aptmp$i.nc 273.15 SUB = aptmp$i.nc
    gmt grdmath tmax$i.nc 273.15 SUB = tmax$i.nc
    gmt grdmath tmin$i.nc 273.15 SUB = tmin$i.nc
done

rm gfs* ncfile* tmin12.nc tmax06.nc aptmp06.nc
This gives us three values; tmin06.nc tmax12.nc and aptmp12.nc (the aptmp just serves as the background map, so no need to care too much). To get the values is the next part. Here we use Climate Data Operators (CDO) outputtab function to get a value on, or very close the specified Lat/Lon point. The value also had to be easily plotted on a map using GMT’s pstext function, this means I had to hack bash’s echo function. Here is the script.
#!/bin/bash
# Get Temprature values for the following towns in North-West

nw=nwtmp.dat
potchefstroom=(lon=27.09_lat=-26.71)
rustenburg=(lon=27.25_lat=-25.65)
mafikeng=(lon=25.65_lat=-25.85)
lichtenburg=(lon=26.10_lat=-26.17)
zeerust=(lon=26.10_lat=-25.55)
suncity=(lon=27.09_lat=-25.34)

## Get temperature using CDO
echo -n "27.09 -26.71 12 0 1 LM Potchefstroom" > $nw
echo -n "$(cdo outputtab,value,nohead -remapnn,$potchefstroom tmin06.nc)" >> $nw ; echo "$(cdo outputtab,value,nohead -remapnn,$potchefstroom tmax12.nc)" >> $nw
echo -n "27.25 -25.65 12 0 1 LM Rustenburg" >> $nw
echo -n "$(cdo outputtab,value,nohead -remapnn,$rustenburg tmin06.nc)" >> $nw ; echo "$(cdo outputtab,value,nohead -remapnn,$rustenburg tmax12.nc)" >> $nw
echo -n "25.65 -25.85 12 0 1 LM Mafikeng" >> $nw
echo -n "$(cdo outputtab,value,nohead -remapnn,$mafikeng tmin06.nc)" >> $nw ; echo "$(cdo outputtab,value,nohead -remapnn,$mafikeng tmax12.nc)" >> $nw
echo -n "26.10 -26.17 12 0 1 LM Lichtenburg" >> $nw
echo -n "$(cdo outputtab,value,nohead -remapnn,$lichtenburg tmin06.nc)" >> $nw ; echo "$(cdo outputtab,value,nohead -remapnn,$lichtenburg tmax12.nc)" >> $nw
echo -n "26.10 -25.55 12 0 1 LM Zeerust" >> $nw
echo -n "$(cdo outputtab,value,nohead -remapnn,$zeerust tmin06.nc)" >> $nw ; echo "$(cdo outputtab,value,nohead -remapnn,$zeerust tmax12.nc)" >> $nw
echo -n "27.09 -25.34 12 0 1 LM Sun-City" >> $nw
echo -n "$(cdo outputtab,value,nohead -remapnn,$suncity tmin06.nc)" >> $nw ; echo "$(cdo outputtab,value,nohead -remapnn,$suncity tmax12.nc)" >> $nw

#sed -i 's/\.[0-9]*//g' $nw
So GMT reads a point value to plot via pstext as LAT LON FONTSIZE ANGLE FONTTYPE CAPTION so in this case I needed 27.09 -26.71 12 0 1 LM Potchefstroom in the script, as you see before every CDO command I echo this part with the details as needed. The sed command was to remove decimal places, but at the momement it removes the coordinate decimal places to, which I don’t want. The output looks like this (named nwtmp.dat):
27.09 -26.71 12 0 1 LM Potchefstroom 12 | 26
27.25 -25.65 12 0 1 LM Rustenburg 13 | 28
25.65 -25.85 12 0 1 LM Mafikeng 13 | 25
26.10 -26.17 12 0 1 LM Lichtenburg 12 | 25
26.10 -25.55 12 0 1 LM Zeerust 13 | 27
27.09 -25.34 12 0 1 LM Sun-City 14 | 27
Now the actual plot comes in, using GMT I do:
!#/bin/bash

# West/East/South/North
nw=22.4/28.4/-28.12/-24.5

# North West
gmt psbasemap  -R$nw -JM25.5 -Ba -Xc -Yc -K > nw.ps
gmt makecpt    -Cjet -T-10/40/0.5 > aptmp.cpt
gmt grdimage   -R aptmp12.nc -Captmp.cpt -J -O -Q -K >> nw.ps
gmt pscoast    -R -J -O -K -W -Sskyblue -Df >> nw.ps
gmt psxy        ZAF_adm1.gmt -R -J -O -Wfaint -V -K >> nw.ps
gmt psxy        nwtmp.dat -R -J -K -O -W0.5 -St0.65 -Gblack -V >> nw.ps
gmt pstext      nwtmp.dat -R -J -X0.10 -Gwhite -O -K >> nw.ps
Here we have our map then
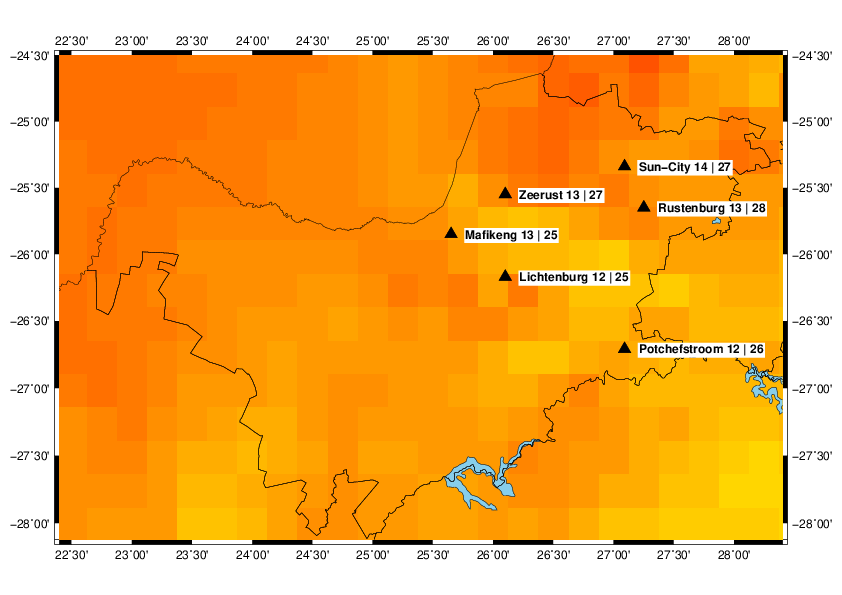
The pixels are a little ugly, the way forward here is to play with grdcontour and also the cpt file. The eventual plan is to make map like this for every province, but it takes time to enter the coordinates, as soon as that’s done it’s easy. Another issue is the .dat file, I need to figure out how to remove the temperature decimal places, but not the Lat/Lon. I think this is possible with AWK. I also plan to add MSLP and CAPE values to the output which could be interesting. It should not be to hard to add anything actually, percentage cloud cover could also be cool.
Ps. If you use the script give credit to GMT and CDO.